3 New Indicators for Your Facebook Ads
Facebook Ads Guide
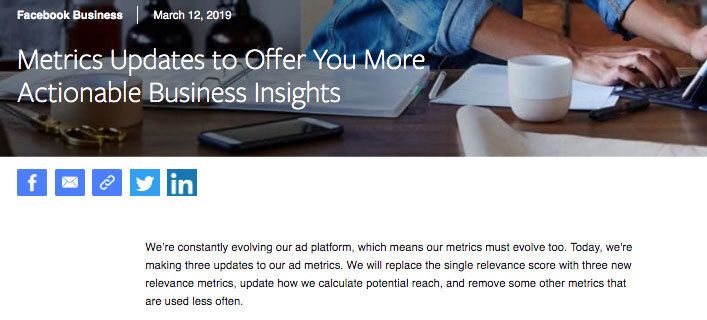
2019 is a year of change for Facebook, notably when it comes to metrics available on its Ads Manager. On March 12, the platform announced an interesting update for advertisers: its Relevance Score would disappear in favor of 3 new metrics.
2019 is a year of change for Facebook, notably when it comes to metrics available on its Ads Manager. On March 12, the platform announced an interesting update for advertisers: its Relevance Score would disappear in favor of 3 new metrics.
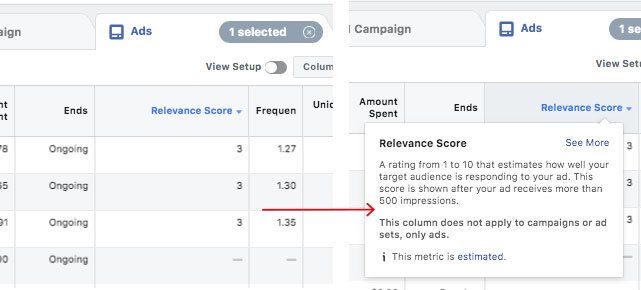
The relevance score was a grade between 1 and 10 that Facebook attributed to each ad (only visible in the Ad tab) once it had enough data.
Keep in mind that this metric had always been a real mystery to anyone advertising on Facebook. Indeed, even if a score was given, it was hard to pinpoint exactly what Facebook wanted us to improve in our advertising.
So much so that we often simply decided to overlook it for traffic or conversion campaigns! Personally, I’ve had ads with a very low relevance score, even though my acquisition costs were perfect.
In this article, we'll discuss why Facebook has undertaken to modify its relevance score and replace it with 3 new metrics.
Then, we'll look at how these 3 KPIs can be used to optimize your Facebook campaigns.
I - Facebook Indicator: The Mystery Is Solved
As I mentioned earlier, although its elements were interesting, the relevance score was a bad metric for advertisers because it was too vague.
In the article "16 metrics to follow for your Facebook campaign," we discussed how the relevance score was calculated using 3 elements:
- Ad performance: Did it manage to achieve its 50 conversion events per week (for example)?
- Positive interactions by people who saw your ads.
- Negative interactions (for example, when someone clicks "Hide" on your ad).
In reality, we were able to examine each of these elements:
-
Performance: by looking at the cost per action and the number of actions performed.
-
Positive interactions: by looking at interactions, video views, and clicks.
-
Negative interactions: complicated to analyze on an ad, but possible on posts
The relevance score was, essentially, a synthesis of these 3 elements.
However, Facebook understood that not everyone was satisfied with this metric. As a result, they decided to make a change and strive for transparency in the goal of improving the ads (and thus the content) on its platform.
NOTE: According to ads managers, it's still possible to have a look (or not) at your ad’s relevance score. I have noticed it with various clients.

To find out if you still have access to the relevance score, simply go to the metrics columns and create a custom table. After that, search for "relevance score" or "score de pertinence" depending on your manager’s language settings.
But back to our new metrics!
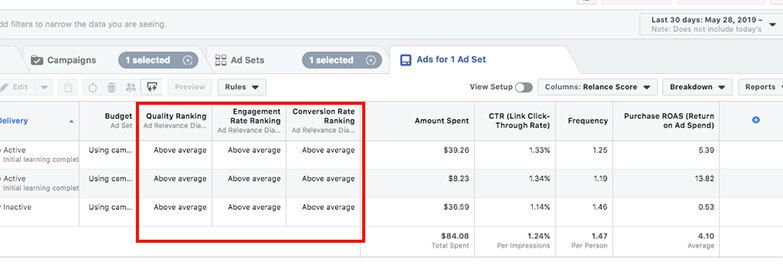
After having made its announcement, Facebook introduced:
-
Quality Ranking : perceived quality of your ad compared to other ads targeting the same audience.
-
Engagement Rate Ranking : expected engagement rate of your ad compared to competing ads targeting the same audience.
- Conversion rate ranking: your conversion rate compared to other ads that have the same objective and the same audience.
Interestingly, Facebook makes it clear that these metrics are calculated by comparing you to your direct and indirect competitors.
Moreover, the result is not a score between 1 and 10, but rather a ranking between the following 5 options:
- Above average
- Average
- Below average (bottom 35% of ads)
- Below average (bottom 20% of ads)
- Below average (bottom 10% of ads)
With these rankings, you have a much better idea of the "extent of the damage" if your ads are not converting.
Facebook then tells us the following: going from Below Average to Average will have more impact on your results than going from Average to Above Average.
And I quote: "Exceptional relevance is linked to high-level performance, but it doesn't always explain remarkable results."
We can therefore conclude that significant growth is to be expected if you manage to improve all your "below average" ads, and more so than if you were to simply rework your average ads. Making them go from average to above average won't cause Facebook to bring you more results.
This is interesting because it reflects Facebook's desire to guarantee quality content for its users rather than showing ads that aren’t engaging and that would, eventually, drive them away.
Now, let's see how to address each of these metrics.
II - How to use Facebook Metrics
A. Quality Ranking
This metric should tell you if your ad’s perceived quality is good compared to that of your competitors. It's certainly the vaguest metric of the three, in my opinion.
We can safely assume that it takes into account negative feedback on your ads (e.g. someone who doesn’t want to see it anymore and hides it because it's too repetitive), but that's all!
It's when we focus on the optimizations that can be made that we get a better understanding of its purpose and usefulness.
Here are Facebook’s Recommendations when your ad does not obtain the highest ranking.
Average or Above: All is well, your ad can still be optimized based on your advertising objective.
Below Average or Average: you need to improve the quality of your ad’s visuals or find an audience that is more likely to show interest in your content.
This means that the Quality Ranking takes into account your ad’s visuals. You may need to improve or adapt the design or format of your ad depending on its placement. Here's an example with the Stories format.

On one side, we have a square image which, once in Story format, has to be adapted by Facebook in order to be displayed (you can also see part of the ad copy). On the other side, we have a format that was specifically designed for Stories (I would recommend reading our article on the Power 5 for a more in-depth explanation).
Facebook could, therefore, choose to favor the format on the right over the one on the left, which needs to be adapted. This is a mere hypothesis, as the left one could still perform very well (it should be tested).
However, we can admit that the one on the right supports a higher-quality experience on the network.
B. Engagement Rate Ranking
More transparent than the previous one, this metric takes into account elements that Facebook qualifies as interactions (e.g. likes, shares, saved posts, comments, video views, clicks, etc.).
Not all interactions have the same value. Knowing that Facebook particularly appreciates meaningful interactions, one might think that a lengthy comment has greater value than a simple like.
Here are Facebook’s Recommendations when your ad does not obtain the highest ranking.
Average or Above: All is well, your ad can still be optimized based on your advertising objective.
Below Average or Average: your ad’s relevance needs to be improved by testing different copy (text) / visuals / offers or even audiences.
Ultimately, this metric is similar to the quality ranking (in terms of recommendations) except that it is focused on engagement with your ads (such as “likes”).
C. Conversion Rate Ranking
Once this is done, you will be able to import a format specifically for that placement. Take into account, however, that your ad will no longer be able to be duplicated by its ID and that you will only have original ads.
In short, with Automatic Placements, Facebook is telling you to stop using placements that have become too expensive or that aren’t always accessible.
3 - Dynamic Product Ad or DPA
This part will be the shortest of the article, because we've already discussed this system in another article (part 3B), and because Dynamic Product Ads can be complicated to set up depending on the sales manager that you’re using (e.g. Shopify, WordPress, etc.). Moreover, we cannot say with certainty that this tool is useful to everyone.
To explain how it works in simple terms: when you visit a product page on a website and then return to Facebook, an ad may appear for that product, along with other complementary items. That is a DPA.
D. Facebook Metric (all 3 at the same time)
Of course, the 3 Facebook metrics that we have seen operate in an autonomous and independent manner. Therefore, you may find yourself in a situation where two, or even all three, metrics are in the red!
Here's how to proceed when the following metrics are below average.
Quality & Engagement: Improve the quality of your visuals and/or choose a different audience.
Again, not very helpful...
-
Quality & Conversion: Modify your ad so that it better represents the product/service.
Facebook explains that some products/services naturally exhibit lower conversion rates than others. Therefore, if your conversion rate doesn't improve after performing a few tests, it might be that what you offer is too hard for Facebook to sell. Also, don't compare yourself to other products/services that aren't similar to yours.
Conversion & Engagement: Improve your ad’s relevance through your visuals, audience, call to action, or post-click experience.
The problem is bigger than in the case of Quality & Conversion; ads and landing pages are to be taken into account.
-
All three at the same time: You should review your advertising strategy and test other objectives, ads, offers, and so on.
Are you trying to sell glasses to a blind man?
III – Conclusion
Once again, as they did with the Power 5, Facebook is reaching out to advertisers. That is, sharing best practices so that you’re more likely to get good results.
I touched on this briefly in this article, but it’s in the platform’s best interest to get you to improve your ads.
Indeed, if you have better ads your performance will improve and you will tend to spend more on this platform.
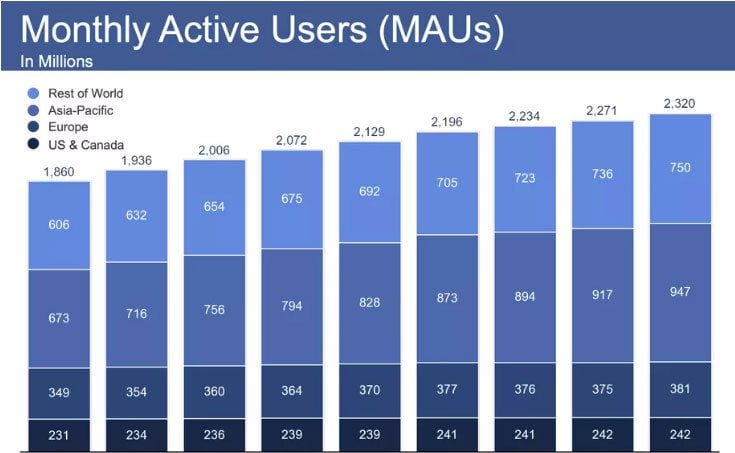
From the user's perspective, seeing high-quality ads contributes to a positive Facebook experience and encourages their commitment to the platform. Once it reaches a certain level, the number of unique users on the platform cannot keep growing as fast as it did in the beginning (at least in America and in Europe, as can be seen below). It's time for the social network to solidify its current user base by providing them with a quality experience.
Finally, in regards to the 3 new metrics that we’ve analyzed, it is without a doubt valuable information to obtain from Facebook. However, these metrics will hardly replace the flagship key performance indicators used in the context of our conversion campaigns, namely: the CTR link, the cost per acquisition, the landing page’s conversion rate, and the frequency.